Get phone and SMS alerts fromPrometheus
Prometheus scrapes time-series metrics from your services and infrastructure, and Alertmanager fires when a rule crosses its threshold. Spike turns each Alertmanager alert into an incident — routed to the on-call engineer by phone, SMS, Slack, and email, and escalated if nobody responds.
Set up with AI
I use Prometheus for monitoring and Spike for on-call and incident management. Walk me through connecting them: create a Prometheus integration in Spike, copy its webhook URL, and add that webhook to Prometheus alert settings. Then help me send a test alert to confirm incidents show up in Spike.
What is Prometheus?
Prometheus is the de facto standard for metrics-based monitoring: it scrapes numeric time-series data from your applications, hosts, containers, and exporters, and stores it for querying with PromQL. Its recording and alerting rules continuously evaluate that data, and when a condition holds — CPU saturation, a queue backing up, an error ratio climbing, a target going unreachable — Prometheus hands the firing alert off to Alertmanager, which handles routing, grouping, and silencing.
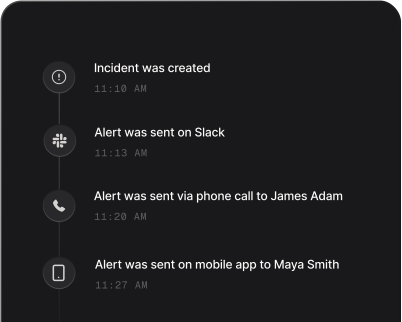
Alertmanager can deliver to email or chat, but those channels rarely wake anyone at 3 a.m. Connected to Spike, every alert that reaches Alertmanager becomes an incident: the on-call engineer gets a phone call and SMS within seconds, the alert escalates to the next responder if it goes unacknowledged, and repeated fires from the same rule are grouped so one flapping target doesn’t bury the pager. Because Spike reads Alertmanager’s resolved notifications, the incident closes itself the moment the rule clears — no manual cleanup of your timeline.
How to set up Prometheus alerts
Every Spike integration is a unique webhook URL. Paste it into Prometheus and alerts start flowing — no agents, no code.
Step 1: Create a Prometheus integration in Spike
In your Spike dashboard, open Integrations and choose Prometheus. Spike generates a unique webhook URL for this integration — copy it.
Step 2: Add Spike as a receiver in Alertmanager
In your alertmanager.yml, add a webhook receiver and paste the Spike URL as its url. Point the relevant route at that receiver so matching alerts are delivered to Spike, then reload Alertmanager.
Step 3: Wire your alerting rules and test
Make sure prometheus.yml references Alertmanager and loads your alerting rules. Trigger a rule — the alert reaches Spike as an incident within seconds, and resolves automatically when Alertmanager sends the recovery.
That's it — Prometheus alerts now page whoever is on call.