Get phone and SMS alerts fromDynatrace
Dynatrace is a full-stack observability and APM platform that watches your applications, services, infrastructure, and user experience, using its Davis AI to surface problems automatically. Spike turns each Dynatrace problem notification into an incident — routed to the on-call engineer by phone, SMS, Slack, and email, with escalation.
Set up with AI
I use Dynatrace for monitoring and Spike for on-call and incident management. Walk me through connecting them: create a Dynatrace integration in Spike, copy its webhook URL, and add that webhook to Dynatrace alert settings. Then help me send a test alert to confirm incidents show up in Spike.
What is Dynatrace?
Dynatrace is a full-stack observability platform that instruments applications, services, containers, hosts, and real users from a single agent. Rather than firing on static thresholds, its Davis AI engine baselines normal behavior, correlates signals across the stack, and raises a “problem” when it detects a genuine degradation — a service slowing down, an error rate climbing, a host running out of resources, or a user-facing regression — along with the likely root cause.
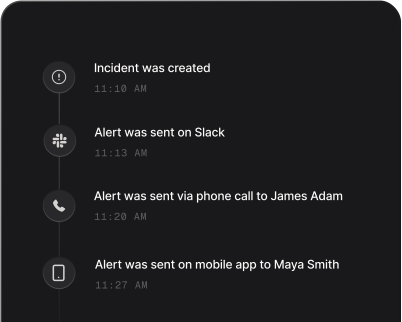
A Dynatrace problem is visible in the dashboard, but visibility isn’t the same as someone acting on it. Connected to Spike, every problem notification becomes an incident: the on-call engineer gets a phone call and SMS within seconds, the alert escalates to the next responder if it goes unacknowledged, and repeated notifications about the same problem are grouped so one long-running degradation doesn’t flood the pager. Because Spike reads Dynatrace’s problem-closed state, the incident resolves itself the moment Davis marks the problem as gone — no manual timeline cleanup.
How to set up Dynatrace alerts
Every Spike integration is a unique webhook URL. Paste it into Dynatrace and alerts start flowing — no agents, no code.
Step 1: Create a Dynatrace integration in Spike
In your Spike dashboard, open Integrations and choose Dynatrace. Spike generates a unique webhook URL for this integration — copy it.
Step 2: Add a custom problem notification in Dynatrace
In Dynatrace, go to Settings → Integration → Problem notifications and set up a Custom integration. Paste the Spike webhook URL into the endpoint field.
Step 3: Add the payload and send a test
Paste the provided JSON into the Custom payload field so Spike receives the problem state, ID, title, impacted entity, severity, and URL. Save, then send a test notification — it appears in Spike as an incident, and resolves automatically when Dynatrace closes the problem.
That's it — Dynatrace alerts now page whoever is on call.