Get phone and SMS alerts fromGrafana
Grafana visualises metrics, logs, and traces on dashboards and fires alerts when a query crosses a threshold or data goes missing. Spike turns every Grafana alert into an incident and reaches the on-call engineer wherever they are — a phone call, an SMS, a Slack ping, or email — escalating until someone acknowledges.
Set up with AI
I use Grafana for monitoring and Spike for on-call and incident management. Walk me through connecting them: create a Grafana integration in Spike, copy its webhook URL, and add that webhook to Grafana alert settings. Then help me send a test alert to confirm incidents show up in Spike.
What is Grafana?
Grafana is one of the most widely used open-source platforms for monitoring and observability, pulling metrics, logs, and traces from dozens of data sources into a single set of dashboards. Its alerting engine watches those queries and fires when a value crosses a threshold, a query fails, or expected data stops arriving.
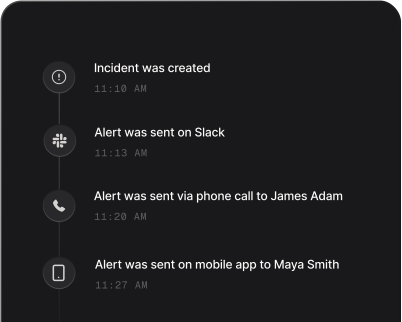
On its own, a Grafana alert lands in an email or a chat channel that is easy to miss outside working hours. Connected to Spike, the same alert becomes an incident: it rings whoever holds the pager on their phone and by SMS, bumps up to the next name in the rotation when it sits unacknowledged, and folds repeat fires from the same rule into one incident instead of a stream of duplicates. And because Spike listens for Grafana’s recovery events, that incident clears itself the moment your query drops back below threshold — your timeline reflects reality without a manual close.
How to set up Grafana alerts
Every Spike integration is a unique webhook URL. Paste it into Grafana and alerts start flowing — no agents, no code.
Step 1: Create a Grafana integration in Spike
In your Spike dashboard, open Integrations and choose Grafana. Spike generates a unique webhook URL for this integration — copy it.
Step 2: Add a webhook notification channel in Grafana
In Grafana, go to Alerting → Notification Channels and click Add channel. Set the type to Webhook, paste the Spike webhook URL into the URL field, and set the content type to application/json before saving.
Step 3: Point your alert rules at the channel and test
Attach the new channel to the alert rules you care about — threshold breaches, query failures, and no-data conditions. Trigger a test alert; it appears in Spike as an incident within seconds and resolves automatically when the alert returns to normal.
That's it — Grafana alerts now page whoever is on call.