Get phone and SMS alerts fromSimple Observability
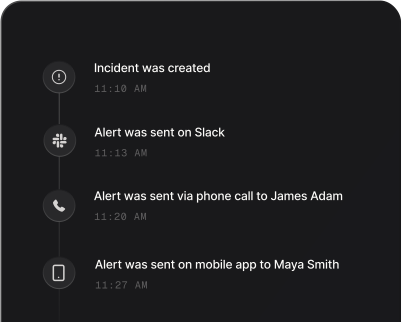
Simple Observability monitors your servers, scheduled jobs and endpoints, and evaluates alert rules over their metrics. When a rule fires, a server stops sending heartbeats, a job fails or an endpoint goes down, Spike pages whoever is on call by phone, SMS, Slack or email, and escalates until someone answers.
Set up with AI
I use Simple Observability for monitoring and Spike for on-call and incident management. Walk me through connecting them: create a Simple Observability integration in Spike, copy its webhook URL, and add that webhook to Simple Observability alert settings. Then help me send a test alert to confirm incidents show up in Spike.
What is Simple Observability?
Simple Observability is a monitoring platform for servers, websites and scheduled jobs. Its agent reports metrics and logs from each server, endpoint checks watch HTTP availability from the outside, job monitoring records each run of a cron task or script, and alert rules fire when a metric crosses a threshold, such as CPU usage above 90% for 5 minutes.
Pointed at Spike through a webhook channel, those alerts become pages. A rule alert opens an incident titled with the rule’s name and description and the hosts that triggered it. A server that stops sending heartbeats, a job that fails, is missed or times out, and an endpoint that becomes unreachable each open an incident titled with Simple Observability’s own sentence about what happened. Who gets paged, and how hard, is decided in Spike with alert routing rules, and an incident nobody acknowledges climbs the escalation policy.
Every rule, server, job and endpoint carries its own id, and Spike uses it to keep alerts together. A repeat for the same one joins the open incident rather than paging again, while two different ones stay two incidents. When Simple Observability reports the recovery — a rule resolved, a server back up, a job that succeeds, an endpoint that is up again — Spike resolves the incident automatically.
How to set up Simple Observability alerts
Every Spike integration is a unique webhook URL. Paste it into Simple Observability and alerts start flowing — no agents, no code.
Step 1: Create a Simple Observability integration in Spike
In your Spike dashboard, open Integrations and choose Simple Observability. Spike generates a unique webhook URL for this integration — copy it, and attach the integration to the service and escalation policy that should answer these alerts.
Step 2: Add a Webhook channel
In Simple Observability, open the Channels page, click Add Channel in the top right corner and select Webhook. Enter the Spike webhook URL and save the channel.
Step 3: Send a test
Click Test on the channel. Simple Observability sends a test message, and it arrives in Spike as an incident titled by its description.
Step 4: Watch an alert become an incident
When a rule fires or a server, job or endpoint fails, Spike opens an incident. Repeats for the same rule, server, job or endpoint join it, and the recovery resolves it.
That's it — Simple Observability alerts now page whoever is on call.