Get phone and SMS alerts fromDash0
Dash0 is an OpenTelemetry-native observability platform, and its check rules fire the moment a service, trace, or metric leaves the range you expect. Spike turns every failing Dash0 check into an incident and pages the on-call engineer — by phone, SMS, Slack, or email — escalating until someone acknowledges it.
Set up with AI
I use Dash0 for monitoring and Spike for on-call and incident management. Walk me through connecting them: create a Dash0 integration in Spike, copy its webhook URL, and add that webhook to Dash0 alert settings. Then help me send a test alert to confirm incidents show up in Spike.
What is Dash0?
Dash0 is an observability platform built on OpenTelemetry rather than around it: your services ship traces, metrics, and logs through the OTel collector, and Dash0 stores and correlates them without a proprietary agent in the middle. Check rules sit on top of that data, evaluating a query continuously and moving between degraded and critical as a latency percentile climbs, an error ratio widens, or a signal stops arriving altogether.
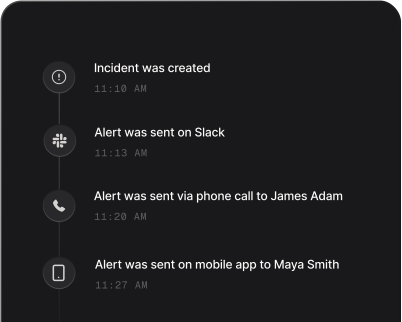
Connected to Spike, a failing check stops being a line in a dashboard and
becomes an incident: it puts a call and a text straight through to whoever holds
the pager, hands the alert to the next tier of the escalation policy when it
goes unacknowledged, and folds repeated failures of the same check rule on the
same resource into one thread instead of a pile of pages. Severity and routing
are yours to decide: a Spike alert rule reads each incoming
check and sets how serious the incident is, who it reaches, and whether it
should be suppressed at all. If the pager should only ever ring for the worst of
it, you can narrow things at the source too, attaching the channel with Dash0’s
critical-only trigger — dash0.failed_check.max_status=critical — so everything
merely degraded stays out of the rotation.
Because Spike follows the lifecycle of the alert and not just its first firing, the incident closes itself the moment the check recovers or the issue is closed in Dash0 — your timeline reflects what the system is actually doing, with no leftover incidents to sweep up by hand.
How to set up Dash0 alerts
Every Spike integration is a unique webhook URL. Paste it into Dash0 and alerts start flowing — no agents, no code.
Step 1: Create a Dash0 integration in Spike
In your Spike dashboard, open Integrations and choose Dash0. Spike generates a unique webhook URL for this integration — copy it.
Step 2: Add a webhook notification channel in Dash0
In Dash0, go to Settings → Notification channels, click Add, and choose Webhook. Name the channel and paste the Spike webhook URL, along with any authentication headers or frequency limit you want on it. Teams who run Dash0 on Kubernetes can declare the same channel as a Dash0NotificationChannel resource instead.
Step 3: Attach the channel to your check rules and test
Assign the channel directly on the check rules you care about, or let label-based routing attract them — a channel that collects the label team set to sre picks up every rule carrying it. Click Send test notification to confirm the wiring, then let a real check fail: it opens an incident in Spike, and the check recovering resolves it.
That's it — Dash0 alerts now page whoever is on call.