Get phone and SMS alerts fromDatadog
Datadog watches your infrastructure, APM traces, logs, and security signals in one place. Spike turns every Datadog monitor alert into an incident — routed to the on-call engineer by phone, SMS, Slack, and email, with escalations if nobody responds.
Set up with AI
I use Datadog for monitoring and Spike for on-call and incident management. Walk me through connecting them: create a Datadog integration in Spike, copy its webhook URL, and add that webhook to Datadog alert settings. Then help me send a test alert to confirm incidents show up in Spike.
What is Datadog?
Datadog is one of the most widely used observability platforms, pulling infrastructure metrics, APM traces, logs, synthetics, and security signals into a single view. Its monitors watch all of that and fire when something crosses a threshold — a host going down, latency creeping up, an error rate spiking, a log pattern appearing where it shouldn’t.
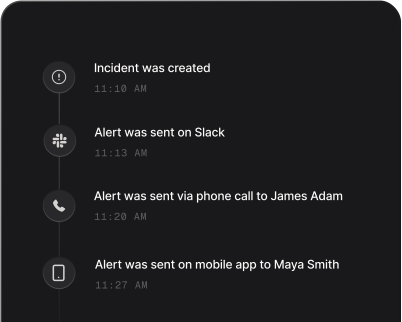
On its own, a Datadog monitor sends an email or an in-app notification, and those are easy to miss outside working hours. Connected to Spike, the same alert becomes an incident: the on-call engineer gets a phone call and SMS within seconds, the alert escalates to the next person if it goes unacknowledged, and repeated fires from the same monitor are grouped so nobody drowns in noise.
Because Spike reads Datadog’s recovery events too, an incident auto-resolves the moment the monitor returns to OK — so your incident timeline stays honest without anyone closing tickets by hand.
How to set up Datadog alerts
Every Spike integration is a unique webhook URL. Paste it into Datadog and alerts start flowing — no agents, no code.
Step 1: Create a Datadog integration in Spike
In your Spike dashboard, open Integrations and choose Datadog. Spike generates a unique webhook URL for this integration — copy it.
Step 2: Add the webhook in Datadog
In Datadog, go to Integrations → Webhooks and click New. Name it "spike", paste the webhook URL you copied into the URL field, and save. The name becomes the handle you notify from a monitor.
Step 3: Notify Spike from your monitors and test
In any monitor's "Say what's happening" message, add @webhook-spike so the alert reaches Spike. Trigger a test notification — it shows up in Spike as an incident within seconds, and resolves automatically when the monitor recovers.
That's it — Datadog alerts now page whoever is on call.