Bugsnag is an error tracking tool that monitors exceptions in your applications and shows them in an easy-to-use dashboard. It also shows you the stability score to help you keep track of your application health. In this guide, we will learn how to use Bugsnag to monitor your software for errors.
Installation
First, sign up for a Bugsnag account and create a new project. You can then add Bugsnag to your code by following the instructions for the project. The installation will involve adding the Bugsnag SDK to your code and initiating it early in your application lifecycle.
Error view
After adding the Bugsnag SDK to your code, it will start capturing unhandled exceptions and sending them to your Bugsnag project. This is how an error will look like in Bugsnag.
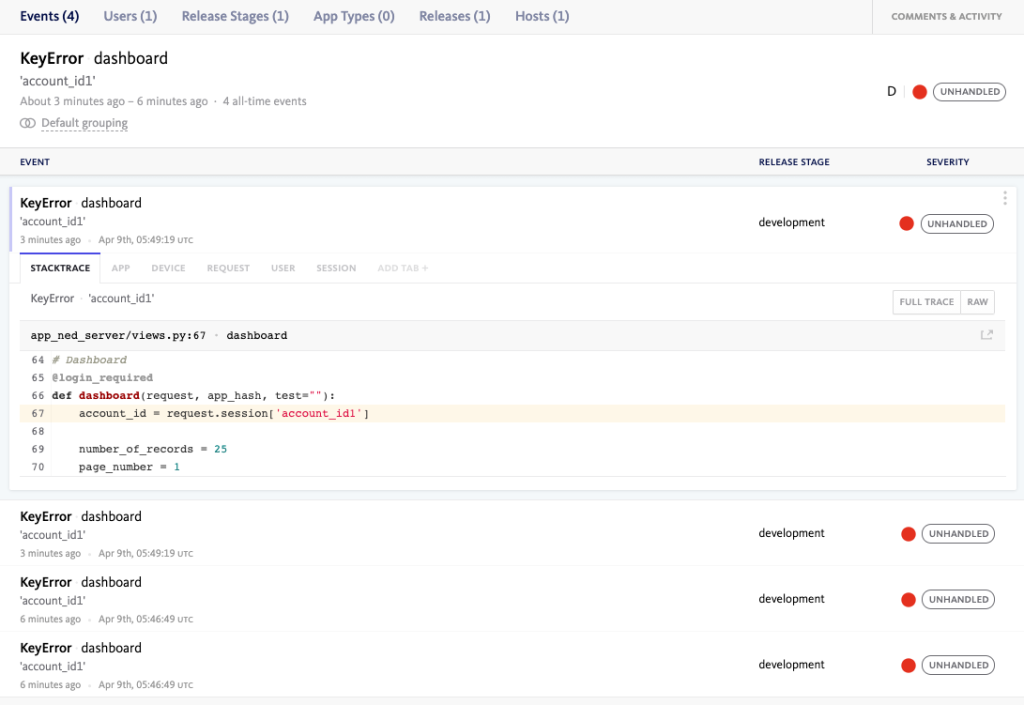
Let’s go over the most important information that is captured for an error –
- Error type and message will be shown at the top.
- The stack trace will show you exactly where the error occurred in your code, and the function stack. This will help you investigate further.
- Device information will show you the hostname and the local language and packages (along with versions).
- The request section will show you the HTTP request details like URL, method, headers and other request data. There is also a pretty useful option to copy the curl command for the request so you can test it again.
- User section will show you information about the customers impacted by the error.
- The session data will show all the session variables and their values.
- You can send custom data to Bugsnag along with the error, which will be shown in a separate section.
- You will also see events data to understand how frequently this error has occurred.
Post-error actions
You have a number of options to deal with the errors inside Bugsnag.
- You can change the error status to fixed. If the error is not important, you can ignore the error or delete the error.
- You can snooze the error until it occurs more times or impacts more users.
- You can assign the error to another team member on your team in Bugsnag.
- You can change the severity of the error to info, warning or error.
- You can send the error to your project management tool like Jira to handle the error as part of your engineering process.
Application stability
Bugsnag shows you insights into the stability of your application by showing you stability score for your projects. The stability score denotes the percentage of sessions and users that were impacted by errors. E.g. 97.3% of users were not impacted by errors.
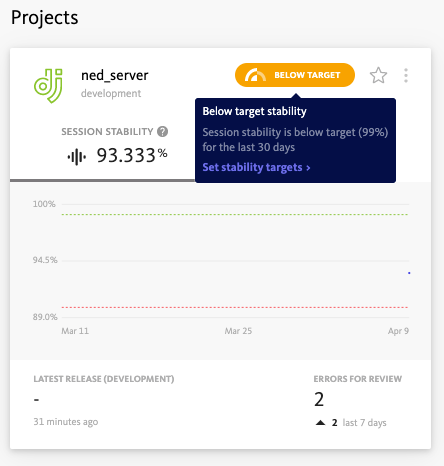
You can set stability targets and see trends of how your team is performing against the targets.
Alerts
To make sure that you don’t miss out on important errors, you can integrate alerting tools with Bugsnag to receive alerts. For example, you can integrate Spike.sh and get alerts on phone call, SMS, Slack and Microsoft Teams whenever an error is detected by Bugsnag.
Conclusion
Improving the stability of your applications is very important because users will leave your application if they face issues. Using an error tracking tool like Bugsnag with alerting functionality from Spike.sh will make sure that you catch and fix serious errors before they affect your customers. If you would like to learn more, drop us a line at [email protected].