Sentry is one of the most popular error tracking tools, which monitors your application for errors and exceptions. Sentry also has an open source version of the product that you can host yourself, but today we will talk about their cloud hosted product.
Installation
You can install Sentry by creating a project in your Sentry account and following the installation instructions. In most cases, you will install the Sentry SDK on the backend or frontend (depending on your project) and start Sentry as early in your application as possible. Sentry supports 90+ platforms, so your language and framework should most likely be in the list.
Sentry’s error view
After you install Sentry, it will start tracking unhandled exceptions and sending it to your Sentry project. Here is what an error from Sentry will look like.
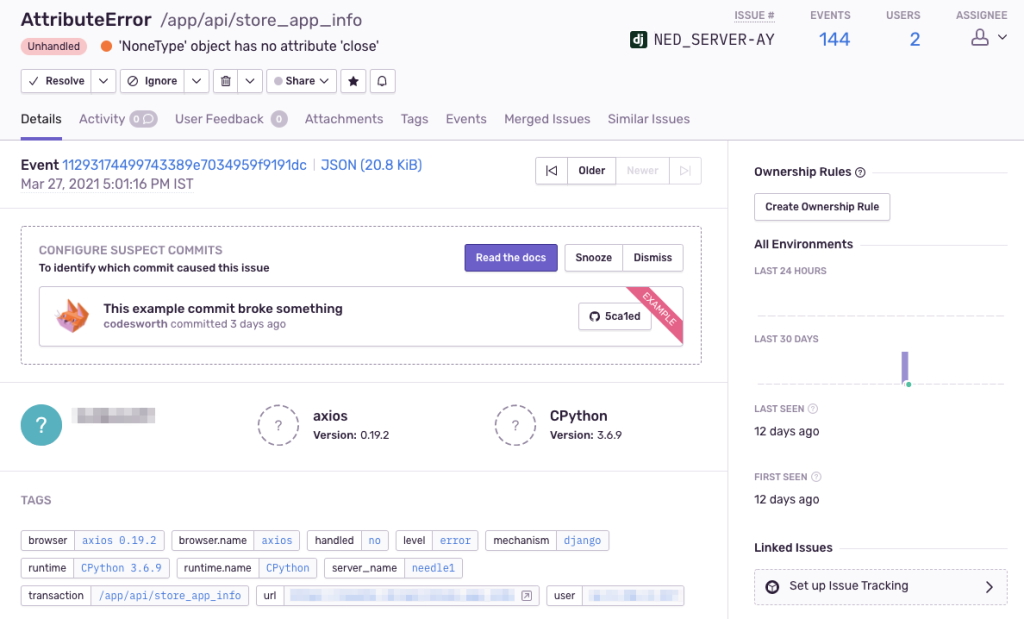
You can see that Sentry shows a lot of valuable information for each error. Broadly, an error in Sentry will show –
- Error information like error/exception type and message.
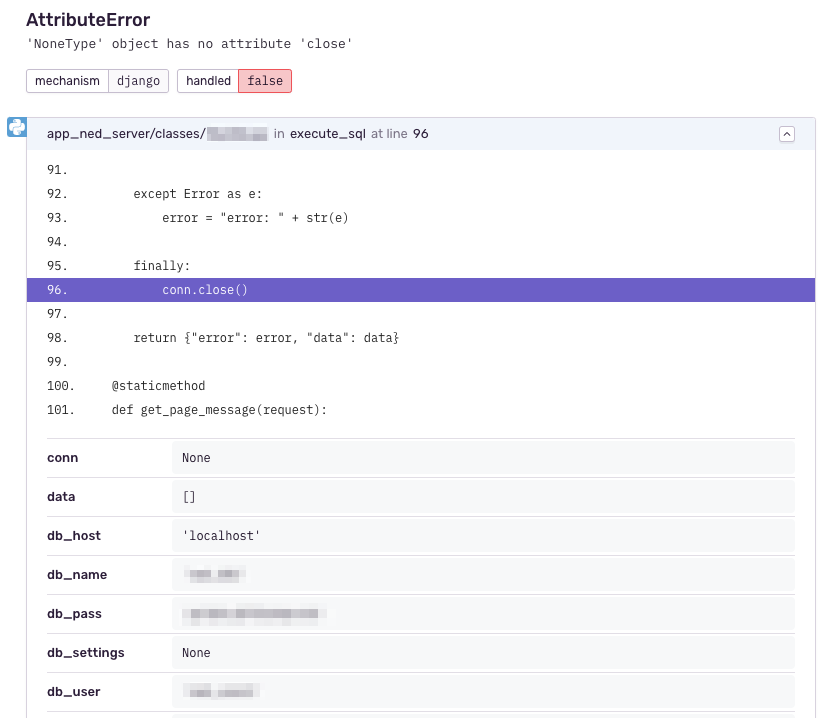
- Stack trace for the error which shows you code snippets of exactly where the error occurred. You will also see values of local variables in your code.
- Environment information to tell you whether the error occurred in your local setup or in production.
- Platform information like device, OS, browser, language etc. It will also show you the packages installed on the server and their versions.
- User information shows you the users affected by this error.
- Events information shows you the number of times the particular error occurred. This can help you set the priority for fixing the error.
The stack trace information is especially useful because it shows you the place in the code that triggered the error, and additional information from the local environment.
Taking actions after the error
Sentry also gives you different actions you can take to track and fix the error.
- Change error status: You can resolve, ignore or delete the error in Sentry if you think that no action is required right away.
- Assign error: You can also assign the error to another team member in your Sentry account so that she can take a look at it.
- Link error to commits: You can connect your continuous integration and delivery (CI/CD) tools like Github which enables Sentry to predict which commit caused the issue. Sentry also uses this to track health of releases using metrics like usage, errors and crashes.
Sending custom messages to Sentry
Although Sentry captures unhandled exceptions automatically, there are cases where you want to send handled exceptions or custom messages to Sentry. The Sentry SDK provides a way to do this using the capture_exception or capture_message method.
Alerts
You can set up alerts in Sentry which can notify you about issues happening in your application. You can create alert rules for whenever a new issue is created, issue frequency increases or the issue status changes from resolved to unresolved.
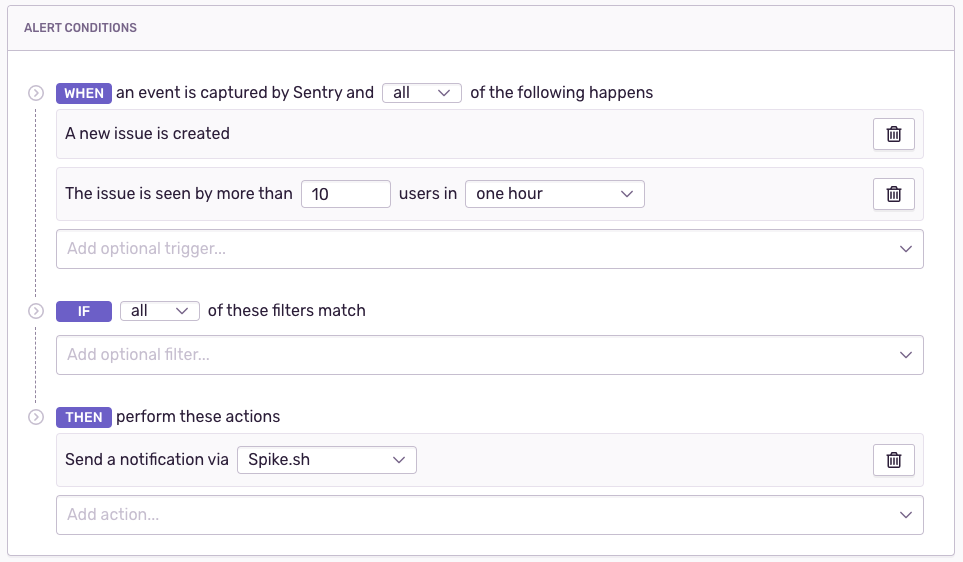
You can receive notification for these alerts on email, or you can connect tools like Spike.sh, which can send you alerts on phone call, SMS, Slack and other channels. This makes sure that important issues are attended to before they snowball into bigger problems.
Conclusion
Sentry’s error tracking can be extremely valuable for you to build better and error free software. If you would like to know how to connect Spike.sh with Sentry, read this guide, or email us at [email protected].