
It all began when I spun up an AWS t4g.small burstable instance for a side project. Nothing unusual just another day in the cloud. But the moment I connected through SSH, something caught my eye.
The system greeted me with a temperature reading of -273.1°C. Wait… what? That’s 0 Kelvin, the point where atomic motion completely stops. In other words, absolute zero , a state that’s theoretically impossible for anything to operate in. For comparison, the coldest natural temperature ever recorded on Earth was -89.2°C in Antarctica (1983). Even in controlled lab experiments, researchers at MIT have only managed to get close to 0 K using advanced laser-cooling techniques.
So how on Earth was my server “running” at absolute zero and responding just fine? Clearly, something wasn’t right. Turns out, that mysterious number wasn’t an actual reading at all.
# sshing in to the server
ssh -i mysshkey.pem ubuntu@public_ip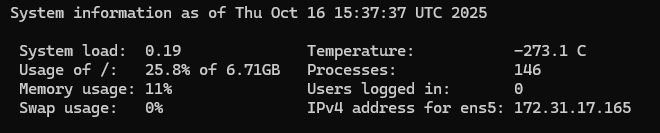
It was a bogus placeholder, quietly sitting inside the system’s Message of the Day (MOTD).
And that discovery sent me down a rabbit hole into the world of Linux MOTDs, dynamic system messages, and a bit of digital detective work.
The Backstory – From Unix Terminal to Basically All Cloud Servers
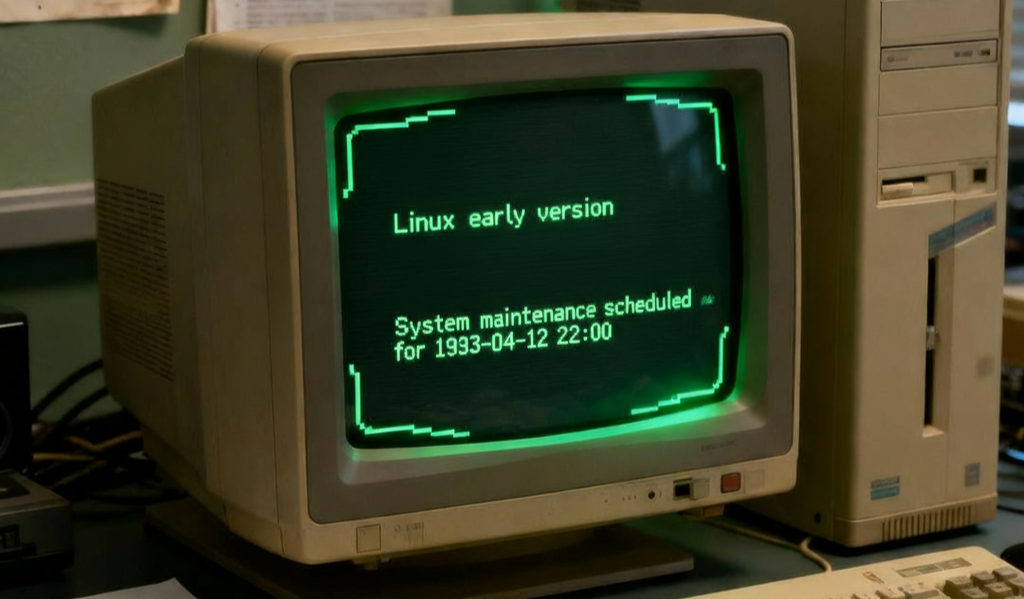
The answer goes back to the early days of Unix, long before the cloud, containers, or even the graphical desktop existed. Back then, system administrators logged into shared mainframes through text-only terminals. When users connected, they were often greeted by a short “Message of the Day” posted by the sysadmin. The MOTD was where admins shared important announcements like:
→ Scheduled maintenance windows
→ New software update and many more.
As Linux evolved and spread across personal computers, servers, and eventually the cloud, the MOTD quietly came along for the ride. What was once a simple noticeboard for sysadmins became a built-in tradition, one that still greets you every time you log in.
Today, in the age of cloud, MOTD has found a new role. It’s no longer just for messages, it’s a tiny dashboard, capable of showing system health, instance metadata, or even deployment info. Ubuntu, for example, takes it further with dynamic MOTDs that change every time you log in, generated by small scripts under /etc/update-motd.d/
So that “-273.1°C” message I saw wasn’t some ghost in the machine, it was a hint that my MOTD was dynamically generated, and something in the chain had gone wrong.
And that’s when I decided to explore how this little greeting message actually works behind the scenes.
How MOTD Works in Ubuntu
Traditionally, MOTD was just a static text file located at /etc/motd. But on modern Ubuntu has moved from static to dynamic MOTDs. Modern Ubuntu versions (like 22.04+) generate MOTDs dynamically using small executable scripts stored in /etc/update-motd.d/.
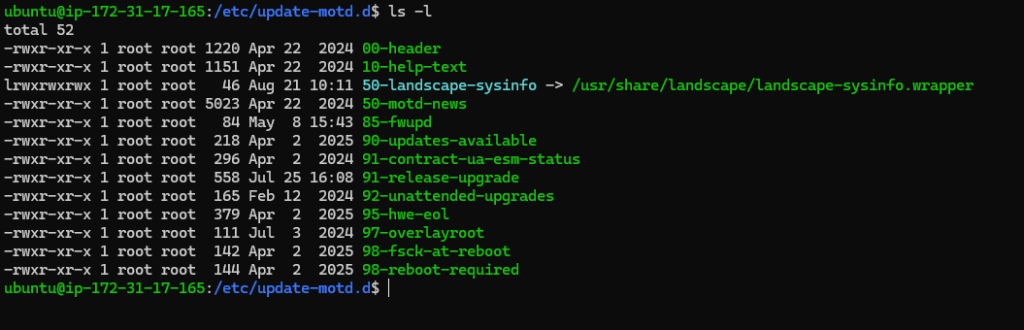
The higher the number, the later the scripts run, it follows to run the scripts in ascending numeric order, so 00- executes first and 99- last.
Each of these scripts run every time you log in via ssh or a TTY session. Their output is combined to form the final MOTD message you see.
For Example:
- 50-landscape-sysinfo → Shows system info (CPU, load, memory)
- 90-updates-available → Displays pending updates
Now after getting how MOTDs worked, I was eager to experiment with custom scripts and see how they would turn out.
Experimenting With Different Scripts
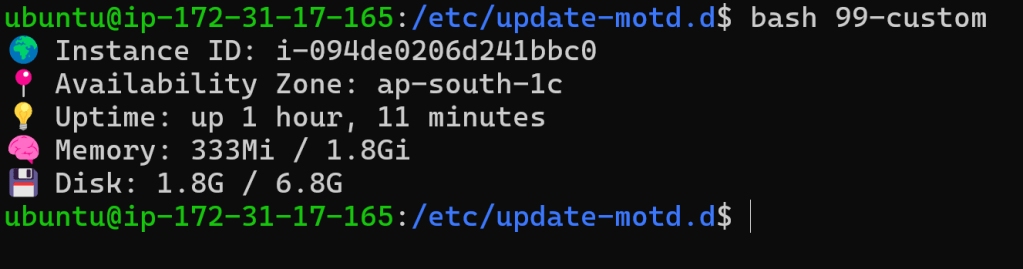
I started with a simple script the goal was to display key instance details like the Instance ID, Availability Zone, Uptime, Memory usage, and Disk usage.
To try it out, created a new file called 99-custom in the /etc/update-motd.d/ directory and wrote the following script, added a few fun symbols to make it more expressive.
sudo nano /etc/update-motd.d/99-custom#!/bin/bash
if command -v ec2metadata &> /dev/null; then
echo "🌍 Instance ID: $(ec2metadata --instance-id)"
echo "📍 Availability Zone: $(ec2metadata --availability-zone)"
fi
echo "💡 Uptime: $(uptime -p)"
echo "🧠 Memory: $(free -h | awk '/Mem:/ {print $3 " / " $2}')"
echo "💾 Disk: $(df -h / | awk 'NR==2 {print $3 " / " $2}')"Now it was time to run the script. To do that, I first gave the file executable permissions and then tested it individually.
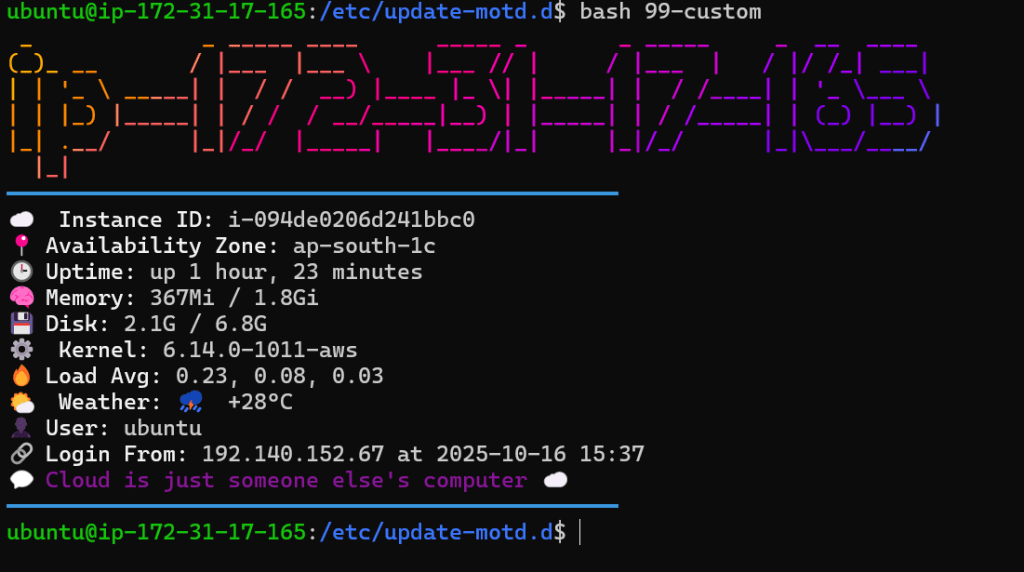
sudo chmod +x /etc/update-motd.d/99-custombash /etc/update-motd.d/99-customThe output turned out just as I imagined clean, colorful, and pretty cool to look at.
Now it was time to try something a little fancy with the script. For that, installed Figlet and Lolcat in the system.
figlet draws big ASCII banners, lolcat colorizes text in rainbow gradient.
sudo apt update
sudo apt install figlet lolcat -y
sudo nano /etc/update-motd.d/99-custom
#!/bin/bash
RED="\e[31m"; GREEN="\e[32m"; YELLOW="\e[33m"; BLUE="\e[34m"
MAGENTA="\e[35m"; CYAN="\e[36m"; BOLD="\e[1m"; RESET="\e[0m"
# it displays the hostname in banner using figlet and lolcat
if command -v figlet &> /dev/null && command -v lolcat &> /dev/null; then
figlet "$(hostname)" | lolcat
else
echo -e "${CYAN}${BOLD}$(hostname)${RESET}"
fi
echo -e "${CYAN}━━━━━━━━━━━━━━━━━━━━━━━━━━━━━━━━━━━━━━━━━━━━━━━${RESET}"
# displays the instance features
if command -v ec2metadata &> /dev/null; then
echo -e "☁️ ${BOLD}Instance ID:${RESET} $(ec2metadata --instance-id)"
echo -e "📍 ${BOLD}Availability Zone:${RESET} $(ec2metadata --availability-zone)"
fi
# displays the system info
uptime_info=$(uptime -p)
mem_usage=$(free -h | awk '/Mem:/ {print $3 " / " $2}')
disk_usage=$(df -h / | awk 'NR==2 {print $3 " / " $2}')
load_avg=$(uptime | awk -F'load average:' '{print $2}' | xargs)
kernel_version=$(uname -r)
echo -e "🕒 ${BOLD}Uptime:${RESET} $uptime_info"
echo -e "🧠 ${BOLD}Memory:${RESET} $mem_usage"
echo -e "💾 ${BOLD}Disk:${RESET} $disk_usage"
echo -e "⚙️ ${BOLD}Kernel:${RESET} $kernel_version"
echo -e "🔥 ${BOLD}Load Avg:${RESET} $load_avg"
# displays the weather
if command -v curl &> /dev/null; then
weather=$(curl -s "wttr.in?format=1")
if [[ -n "$weather" ]]; then
echo -e "🌤️ ${BOLD}Weather:${RESET} $weather"
fi
fi
# displays user info
current_user=$(whoami)
login_ip=$(who | awk '{print $5}' | head -n 1 | tr -d '()')
login_time=$(who -u | awk '{print $3, $4}' | head -n 1)
echo -e "👤 ${BOLD}User:${RESET} $current_user"
echo -e "🔗 ${BOLD}Login From:${RESET} ${login_ip:-N/A} at ${login_time:-N/A}"
# displays a random quote
quotes=(
"Keep it simple, automate everything."
"Cloud is just someone else's computer ☁️"
"In God we trust, all others bring data."
"There is no cloud without coffee ☕"
"DevOps: Because downtime isn’t an option."
)
rand_quote=${quotes[$RANDOM % ${#quotes[@]}]}
echo -e "💬 ${MAGENTA}${rand_quote}${RESET}"
echo -e "${CYAN}━━━━━━━━━━━━━━━━━━━━━━━━━━━━━━━━━━━━━━━━━━━━━━━${RESET}"
The output showed up as a banner, giving the MOTD a bold and vibrant look.
But this wasn’t the only custom script that will run at login, all the other default MOTD scripts were still executing too. And that meant the haunting -273.1°C message will still be appearing every time I ssh the server. So, my little battle to delete or edit that impossible temperature reading began here.
My Failed Attempt to Change The Temperature:
I started by looking into the /etc/update-motd.d/ folder to figure out where the MOTD was fetching the temperature, turns out that all the system-related information is handled inside the 50-landscape-sysinfo script, so opened it with cat, but surprisingly, there was no temperature code there.
After a bit of digging, I discovered that the temperature was actually fetched using the bin. Following the trail, I was directed to check /usr/bin/landscape-sysinfo. That, in turn, led to /usr/bin/python3/ dist-packages/landscape/sysinfo. Inside, a bunch of Python scripts were found and buried among them was temperature.py.
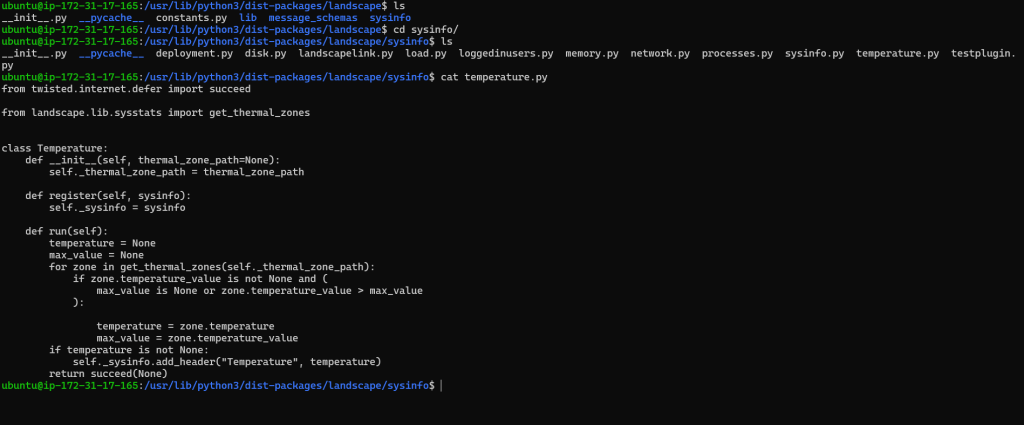
The code further led to landscape.lib.sysstats, and from there it calls get_thermal_zones.
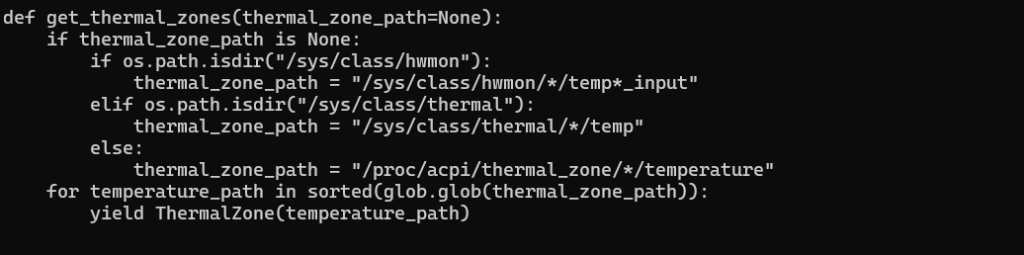
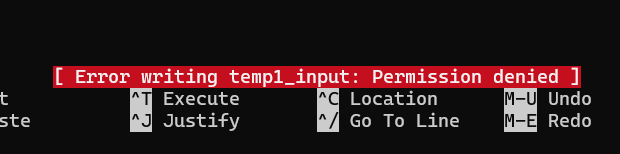
From the code, it looks like it first checks if there is a sensor available. If a sensor exists, it fetches the actual data from there. Otherwise, on a cloud VM where there is no access to system-level hardware data, it returns a placeholder bogus value called temp1_input
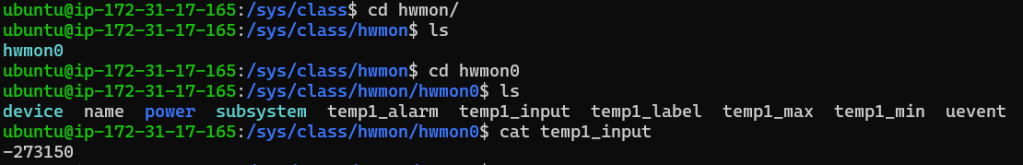
When I tried changing it, 101 Linux Basics came to mind, the part about kernel space and user space. Files inside /sys/class/hwmon/ can’t be modified directly since the kernel protects them from user-level changes.
On a cloud VM, there’s no access to physical hardware sensors, so system files like /sys/class/hwmon/ just return placeholder values. That’s why temperatures like -273.1°C appear it’s the kernel’s way of saying the data isn’t available.
These files are read-only placeholders, so attempting to write just gives a “permission denied” error. That safeguard ensures stability even if something tries to mess with kernel data.
The Tricky Solution:
On Ubuntu cloud VMs, the default 50-landscape-sysinfo script prints system information, including a bogus -273.1°C because cloud instances don’t have access to real hardware sensors.
I figured out two ways to get rid of this bogus temperature value, the first method was simple but effective, by removing the execute permission of the 50-landscape-sysinfo script so it wouldn’t run at all, preventing it from printing the impossible -273.1°C.
The second method was to directly edited the script to override the temperature. By adding a check to see if a hardware sensor exists, make it print a safe value or a friendly message whenever the VM had no real sensor data. This way, the script still showed all the useful system information.
Wrapping Up
MOTDs may look harmless, but on Linux, they can actually pose security concerns. Each script in /etc/update-motd.d/ is executable, meaning any malicious or poorly written script could run commands as your user (or even root if misconfigured). That’s why it’s important to only customize or override scripts you trust, and never blindly copy scripts from unverified sources.
Despite this, MOTDs are incredibly useful for quick system insights, showing load, memory, disk usage, cloud metadata, or custom banners all at login. By safely overriding scripts like 50-landscape-sysinfo, you can fix quirks (like the bogus -273.1°C) and make your MOTD both informative and safe.
Happy Exploring!