On 27th June, 2025, we identified an incident in our escalation engine where steps fired out of sequence. Escalation policies containing more than four escalation steps—and at least 2 alerts configured in Step 3 onwards —occasionally triggered step 4 (and subsequent steps) earlier than their defined intervals. Although every notification still dispatched, later steps ran sooner than expected.
Table of contents
Summary of the Incident
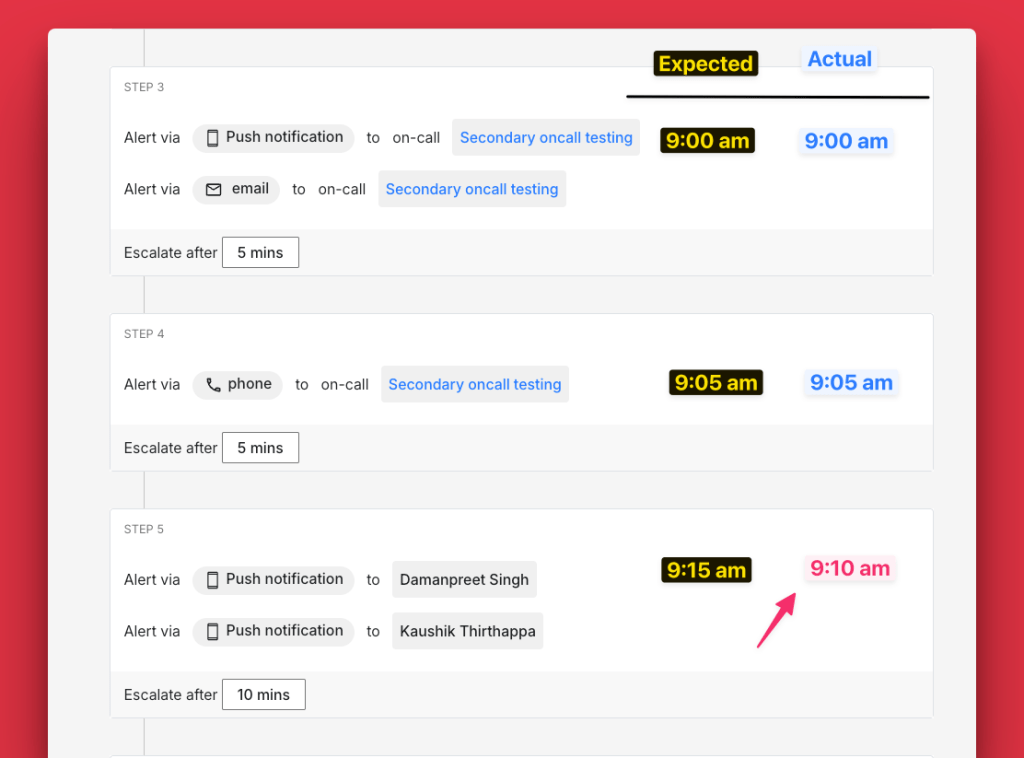
We first became aware of the problem when one of our customers reported that step 5 of their escalation policy fired earlier than expected. They noted that, although step 4 correctly ran at its scheduled time, step 5 sometimes ran at the same time as step 4 rather than at its later timestamp.
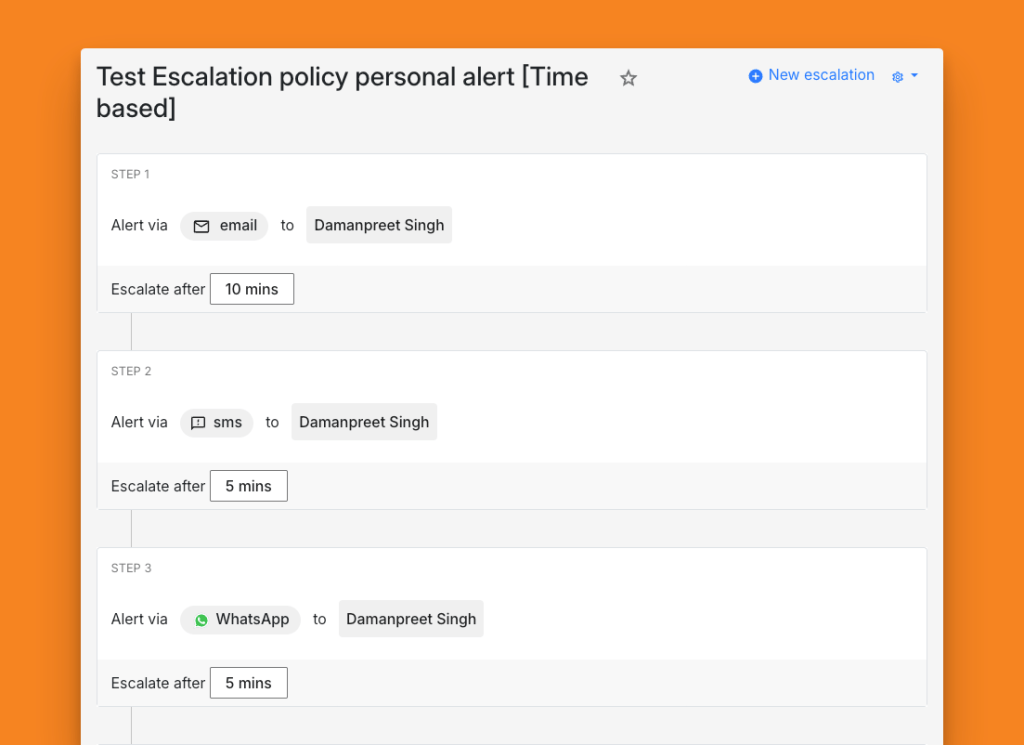
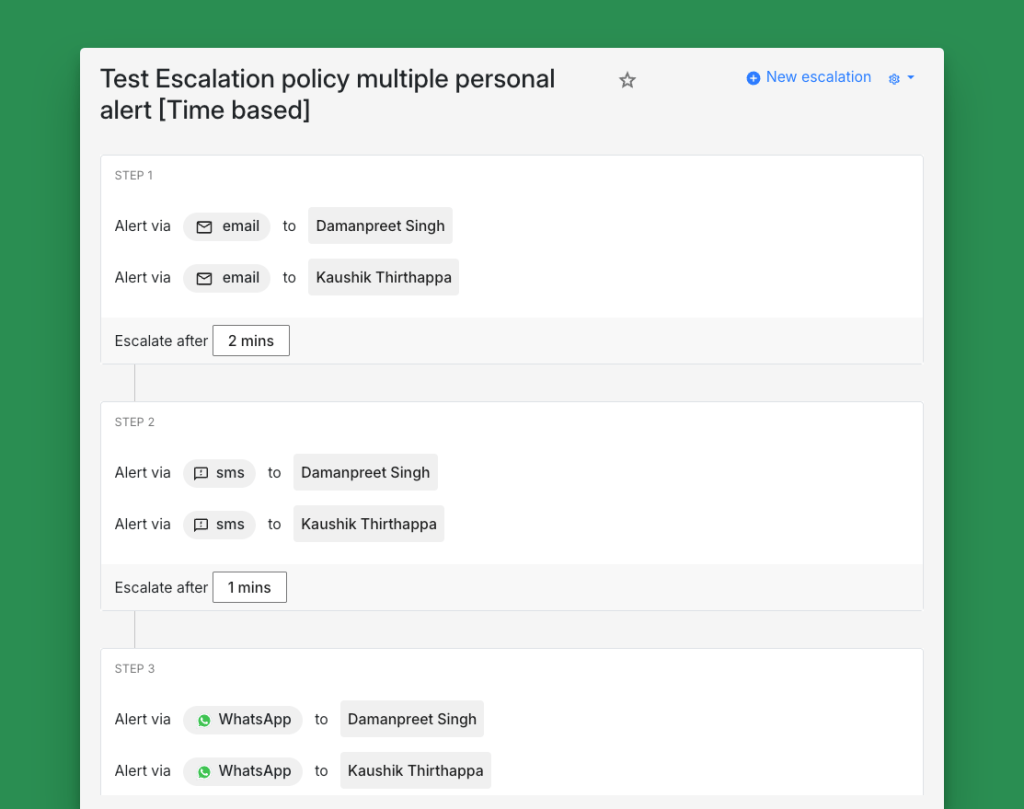
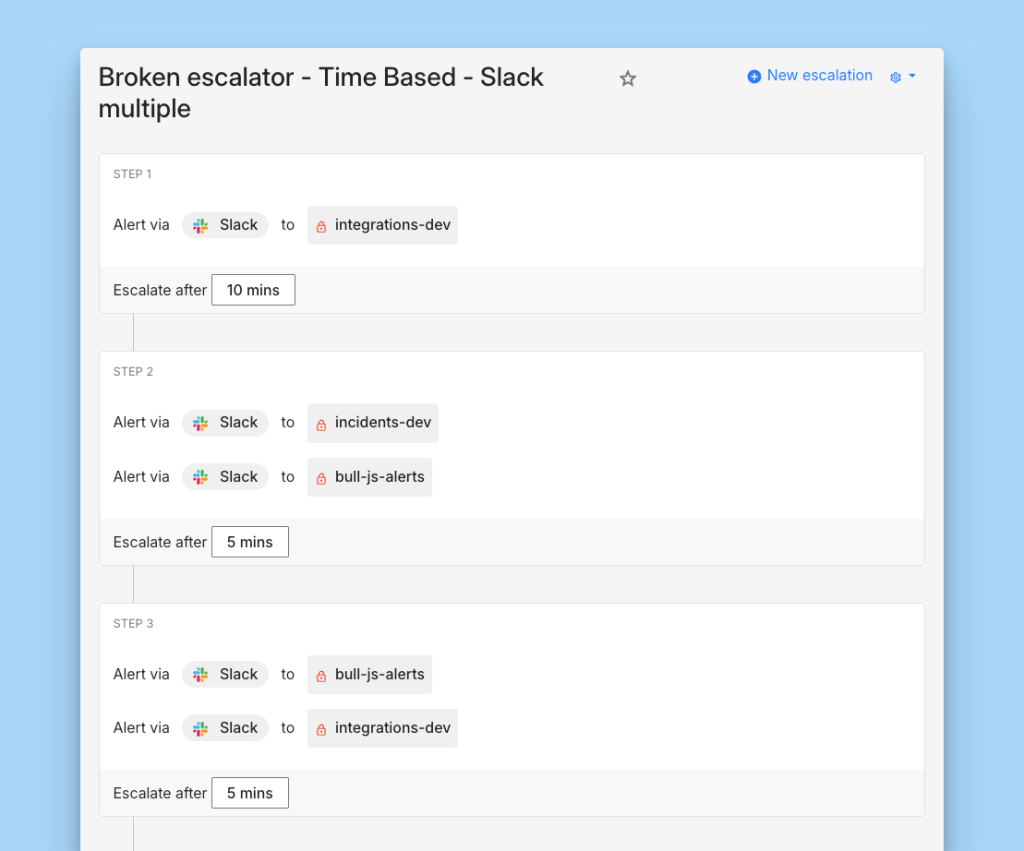
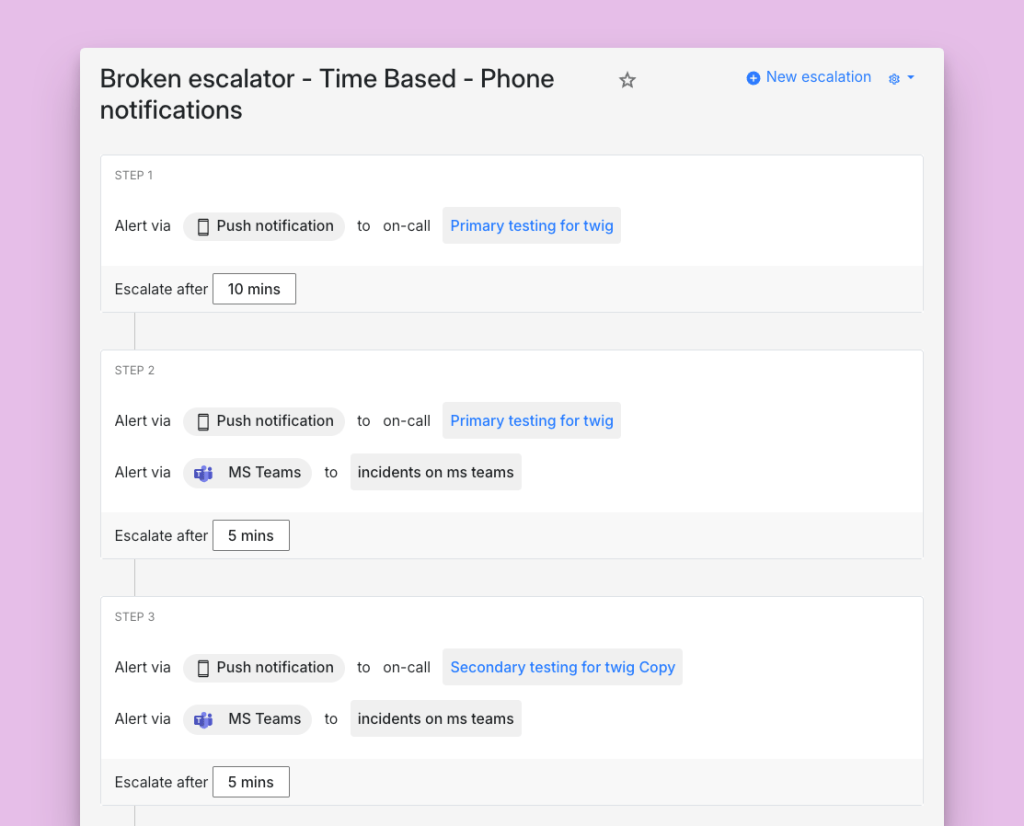
To reproduce the issue, we set up a policy with five steps and configured multiple alerts in step 3.
- Step 3: fired at 9:00 AM
- Step 4: fired at 9:05 AM
- Step 5: scheduled for 9:15 AM, but also ran at 9:05 AM
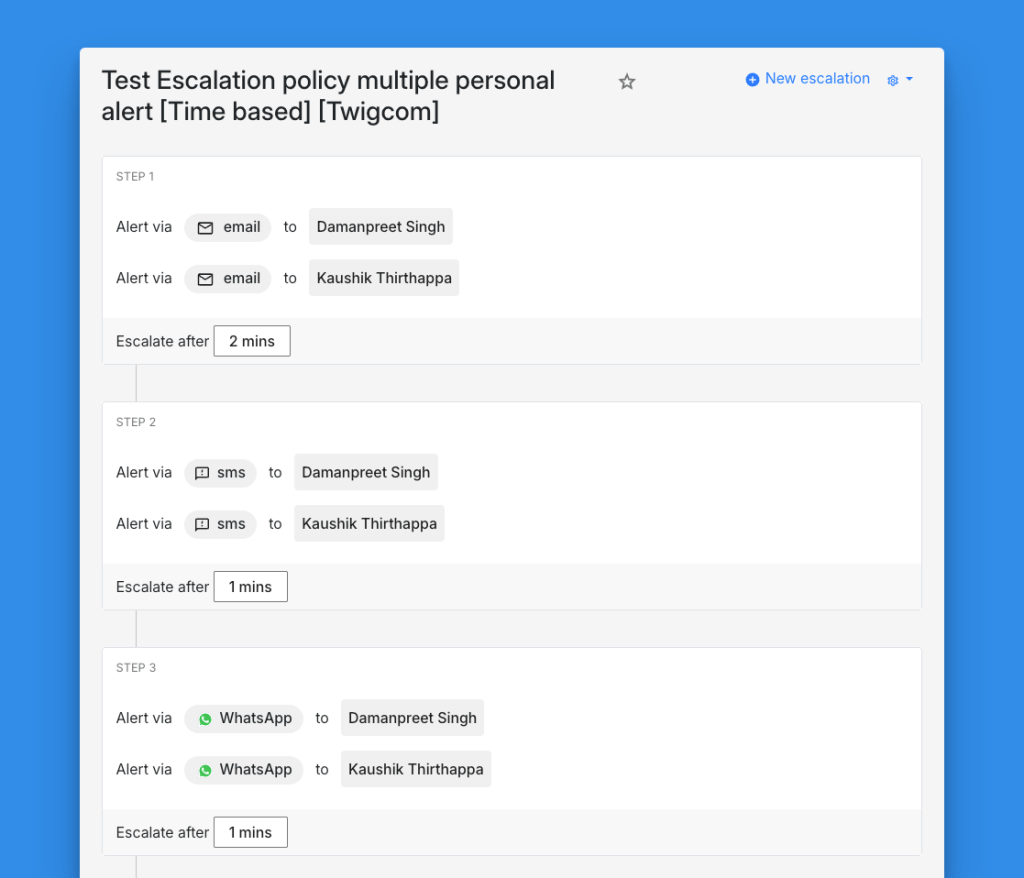
This behavior defied our design: Spike only ever queues the very next step after an alert goes out. That queuing logic prevents the system from overloading and lets us decide in real time which escalation step should run next. It’s worth noting that each escalation step can contain multiple alerts, and in this scenario the mis-queue occurred even with multipe alerts in step 3.
After receiving the initial report on 26th June, we tried and failed to replicate the issue in our staging environment. That led us to pull logs from multiple active users’ policies to see if others had been affected. We reviewed escalation‐queue entries and alert timestamps but didn’t find any additional confirmed cases.
Detection
We first attempted to reproduce the issue in both staging and production by creating escalation policies with five and six steps, and by varying the number of alerts per step. Despite repeated tests, we saw no anomalies. To gain more visibility, we routed all queue and timestamp data through our internal debugging service, Warden, and augmented our logging to capture every enqueue operation.
Early in the investigation, we hypothesized a feature-flag misconfiguration—since the report came from a new customer—but quickly ruled this out. Our escalation engine isn’t gated by flags based on plan or customer tier; alerts and step-count limits vary only by plan, not by a feature toggle governing queuing behavior.
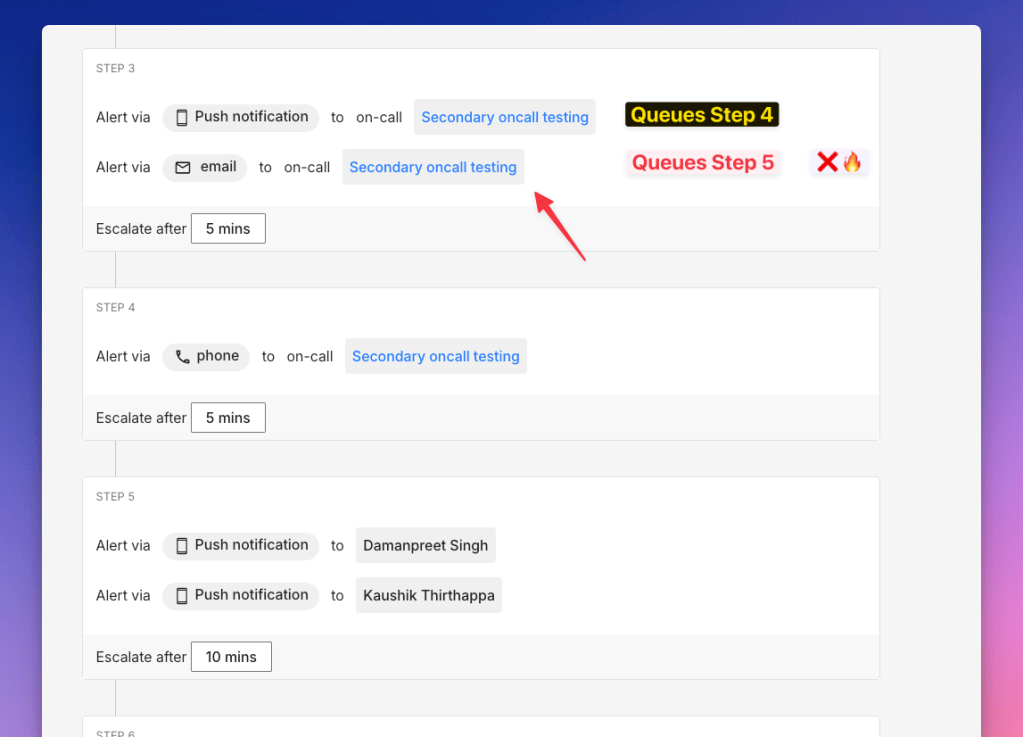
The enhanced logs revealed the true culprit: when step 3 contained multiple alerts, each alert invocation independently re-queued “the next” step using the same base timestamp. The first alert in step 3 correctly queued step 4 at T+5 minutes, but the second alert also read the original timestamp and enqueued step 5 at T+5 minutes—skipping the intended interval. The timeline below might illustrate this better:
- Step 3 fires at 9:00 AM and has 2 alerts: A and B
- Alert A queues Step 4 for 9:05 AM
- Alert B also queues its “next” step—Step 5—for 9:05 AM instead of 9:15 AM
- Result: Step 5 runs too early because each alert reused the original timestamp rather than chaining off the previous step.
This timestamp-queuing logic flaw only arises when a step has more than one alert and the step number is > 2
The internal service just pulls a lot more data and we built it to customise what we see in production. Kinda like YouTube stats for nerds.

Recovery
Once we confirmed the queuing-logic flaw, the team updated the escalation engine to enqueue only one “next” step per escalation, regardless of how many alerts a step contains. We merged the fix, ran a quick smoke test in staging, and rolled it out to production. Post-deployment monitoring via Warden showed all steps queuing and firing in the correct order, and no further out-of-order executions have occurred. Service consistency was fully restored shortly after the patch went live.
Lessons Learned and Next Steps
Strengthen Logging Around Queue Operations
Enhance log granularity for enqueue/dequeue actions and include contextual metadata (step number, alert ID) so future investigations surface root causes faster.
Automated Production Escalation Testing
Leverage a daily Cron job in production to trigger incidents across varied escalation policies (different step counts and alert combinations). This live test will make sure our end-to-end queuing logic behaves correctly under real conditions.
Anomaly Detection for Escalation Timing
Map each alert’s expected send timestamp per escalation step, then compare actual execution times on every escalation. If any step fires out of order, automatically open an incident in Spike and notify the on-call team.
Closing Notes
This was a hard-to-catch issue, and we’re grateful to the users who brought it to our attention. We apologize for any confusion it caused. As we strengthen our escalation engine, we’ll keep improving our testing and monitoring. At Spike, we believe in honesty and transparency—please subscribe to our status page for real-time updates.
Thank you for your support.