Making sure that your websites and apps are not slowing down and frustrating your users is important to keep your customers happy. Sentry performance monitoring enables you to find and solve performance issues in your apps.
Installation
First, sign up for a Sentry account and create your project. Then, follow the instructions to install the Sentry SDK inside your application and instantiate it early in your application. For performance monitoring, you can provide a sampling rate which decides the number of requests which will be captured. This rate should be adjusted in production.
Performance dashboard
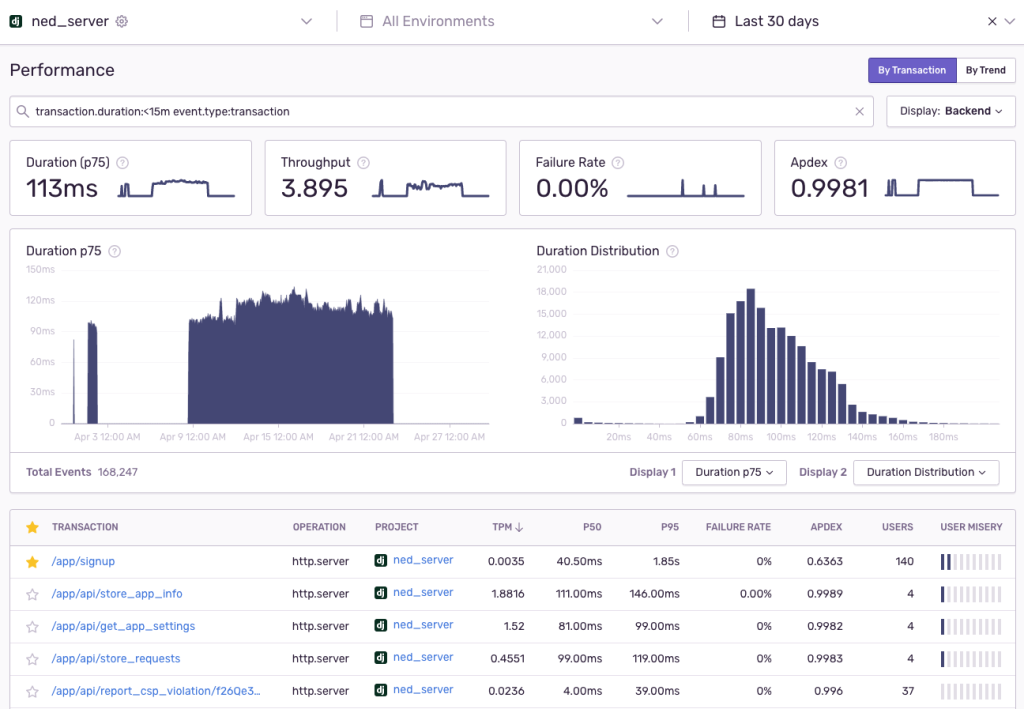
After integrating Sentry, it will start sending performance data to your project. The performance data is shown for transactions, which broadly represent the user requests happening in your application.
The dashboard will show the following metrics –
- Duration: The duration will be shown as a percentile value e.g. p75, which means that 75% of your app’s requests are faster than the duration shown. Percentiles are better than averages because they better represent the experience of the majority of your users.
- Failure rate: This is the percentage of transactions recorded by Sentry that were unsuccessful.
- Apdex: Apdex gives you the measure of customer satisfaction with your application performance, and is calculated as the number of successful and tolerable requests divided by the total number of requests. You can define the threshold for tolerable requests in Sentry’s performance settings.
Sentry also shows you charts to examine the trend and distribution of these metrics.
Diagnosing performance issues
To diagnose performance problems in your application, begin by inspecting the percentile (p50, p95) and apdex values for your transactions. Sentry also provides a User misery metric which highlights the transactions with highest user impact.
After you have found a transaction (or request) which has slow performance, you can go to the transaction summary view for more details. The transaction summary shows the data for all transactions of the same type e.g. performance data for all requests to your website’s sign up page.
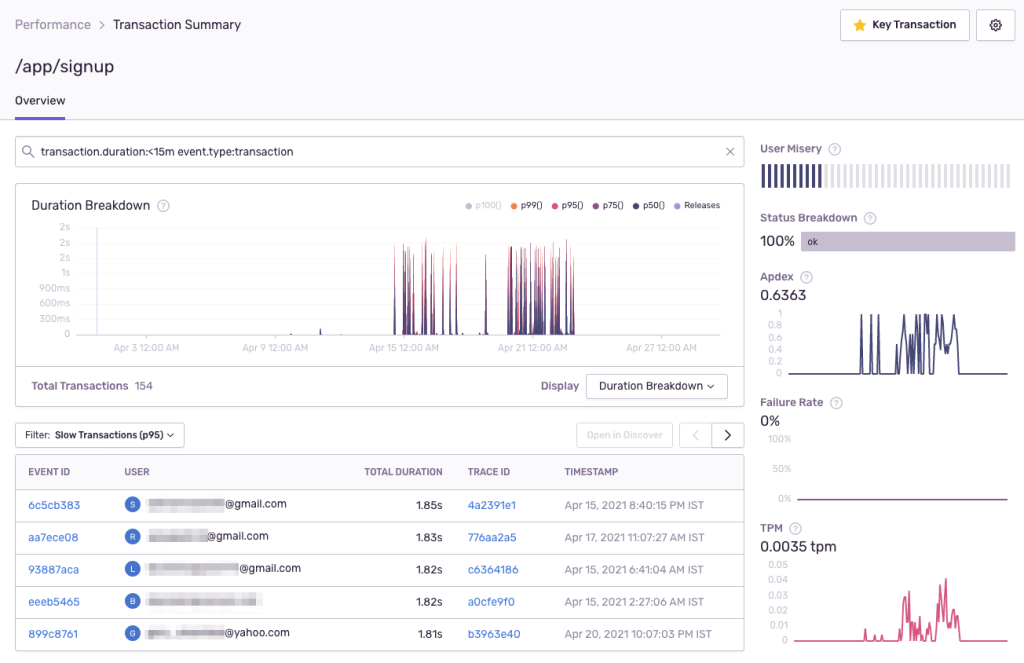
The transaction summary has the following information –
- Graphs showing trends and distribution for transaction related data like percentiles.
- Trends for Apdex and failure rate.
- User misery score denoting the impact of performance issues on your customers.
- Data on the distribution of user device and server information across all the transactions.
- The related issues section shows any errors detected by Sentry’s error tracking product. This can help you diagnose performance issues caused by application errors for that transaction.
To dig deeper into what caused the performance issue, you can see the details for individual instances of that transaction. E.g. you can see the details for a particularly slow request to your login page. You can filter the transactions to find the fastest or slowest ones and select one to understand more.
Transaction details
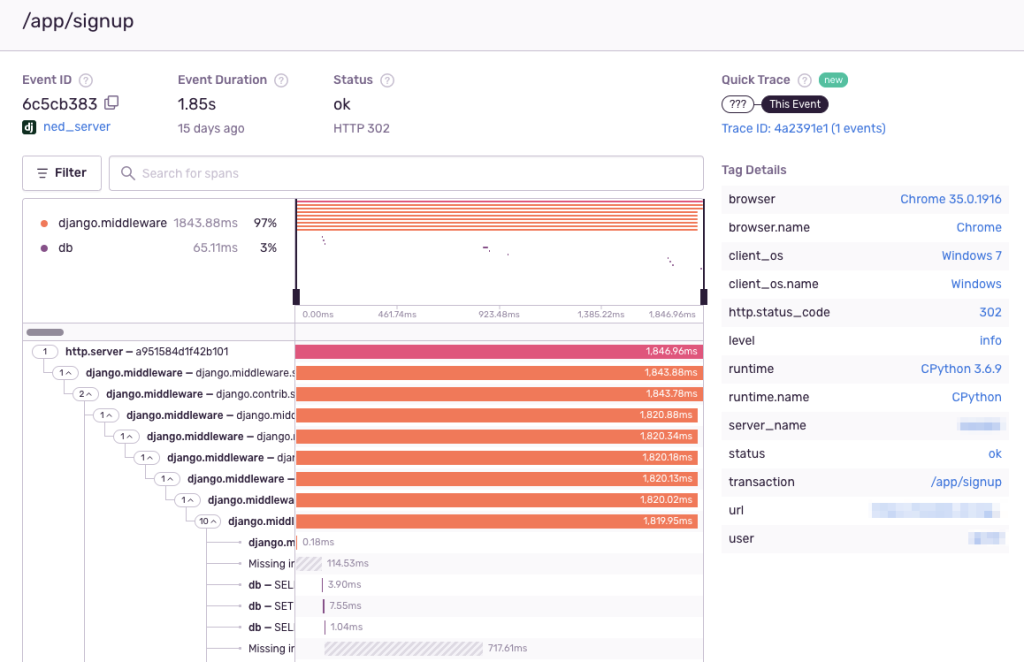
You can see the following information for a particular transaction –
- The duration of the transaction
- Information about the user’s device and the server environment
- User information from your application like user ID and email
- The details of the request like URL, request body and status
To diagnose the cause of a performance issue, you can drill-down to an individual part (called span) of a request and inspect the duration. The span can be a function call, database query etc. You can use the visual tree to find the spans with the longest durations and understand what led to the performance issue.
Alerts
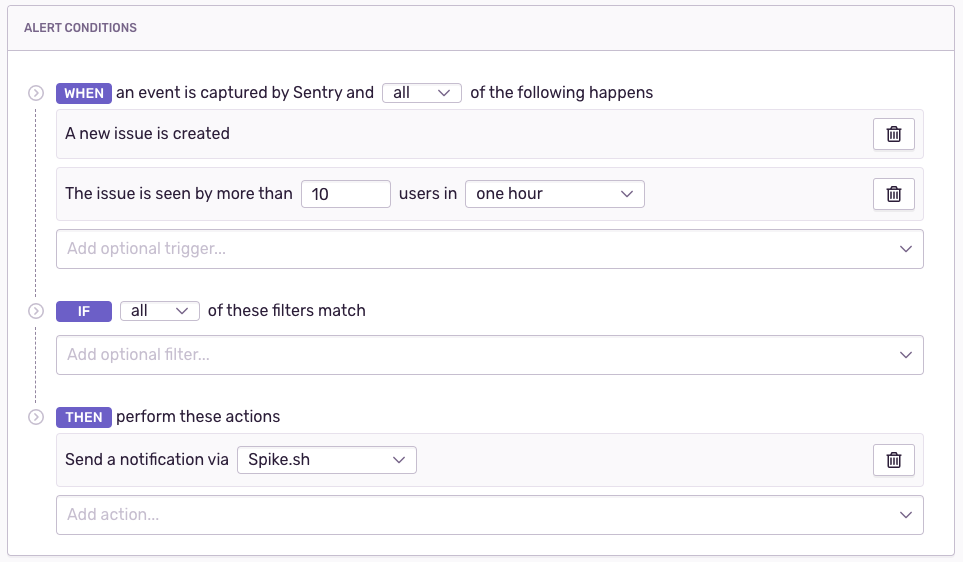
You can configure alert rules in Sentry to be notified when performance issues occur. To make sure that you don’t miss out on important issues in your application, you should set up connect Sentry with Spike.sh. This will ensure that your team will get alerts on phone call, SMS, Slack and Microsoft Teams. You can even set up on-call schedules to assign different team members as first responders.
Conclusion
Keeping your applications loading fast is crucial for customer happiness, and you can achieve that with Sentry’s performance monitoring paired with alerts from Spike.sh. If you would like to know more about monitoring other aspects of your application, email us at [email protected].